In our last blog we explored the potential impact of missingness in data in terms of its impact on models which require complete case analysis. We took a simple view that data was missing with an equal, independent, probability for any given model input. This week we explore cases where this assumption may be too simplistic and methods of imputation.
Before we explore what imputation is, let’s first consider why it can be dangerous. One important consideration of missing data is quite simply, why is the data missing and is there a pattern to it? As a subject matter expert, you may be able to diagnose why data is missing in the first instance, however as a non-expert it may not be abundantly obvious.
The concept here is Missing at Random versus Missing Not at Random. If data is Missing at Random, provided it is done appropriately, imputation can be a valid means of retaining incomplete observations for the purposes of training a predictive model.
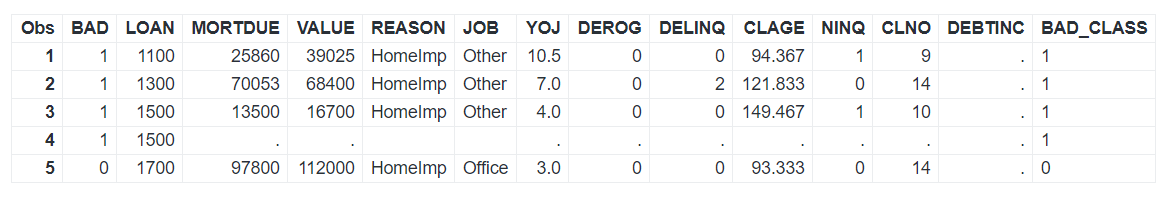
However, where data is Missing Not at Random, there is potentially an explanatory relationship for data being missing. Take, for example, our HMEQ dataset. With this dataset we wish to predict the likelihood of defaulting on a loan, and one of the model inputs is the reason for taking out a loan. If data in this column is missing, how likely is it that this data is missing at random? There may be a clear relationship between a missing reason for a loan application and the likelihood of defaulting on a bank loan, which would seem a reasonable assumption. If we employ a strategy of imputation to get rid of these missing values then we may be losing important information or, at the least, degrading the model’s ability to correctly identify fraudulent cases.
In our first blog we saw that missing data was indeed a consideration for the dataset, as seen in Figure 1, and on first inspection it appears that there might be a relationship between cases of fraud and missing values. Though, we did not look at enough data to come to any conclusions.
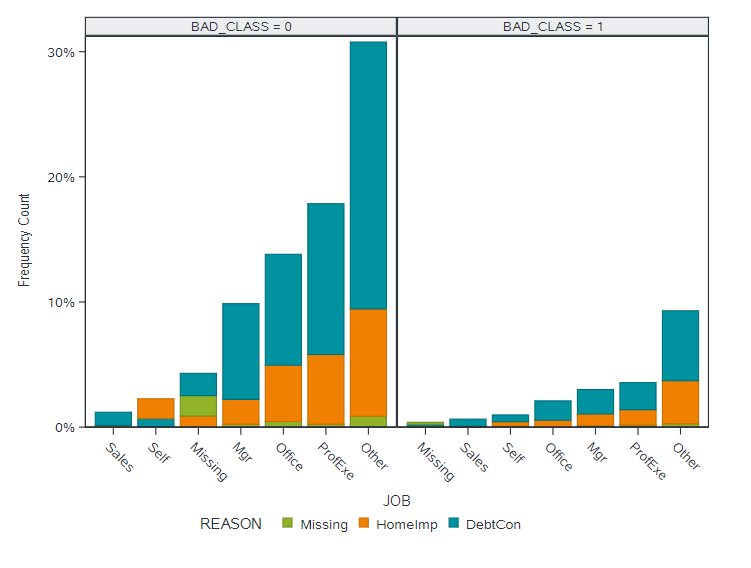
Looking at the frequency of missingness by class in Figure 2, we can see that missing values appear reasonably proportional between the class levels of our target variable. It looks as though missing data may be more of a data quality issue in this case, though we may need further analysis to be sure.
What may be more of an issue than missingness here is the overwhelming majority of ‘Other’ for the job category, this observation may help explain to us our previous results from the Information Gain and Attribute Importance models where job was seen as not being an important explanatory attribute which seemed counter intuitive. The explanation here could simply be that while it would be a useful model input the quality of the data available is too poor to contribute any explanatory power to the model.
This is, incidentally, where I think there is a great value to Citizen Data Science as these analysts generally come into data science from the business side and may already have a strong familiarity with the data they are working with and may be better able to judge whether there is a clear reason for missingness.
Where data is identified as Missing Not at Random, we have a few strategies we can employ. As before, we can consider using a model which handles missing values well – such as a Decision Tree or Naïve Bayes model. These models can consider missingness as explanatory. Another simple approach is to consider Feature Engineering techniques rather than imputation. For example, in our example with the loan application reason we can add replace null values with a surrogate value for missingness. For a numeric attribute we can transform the attribute into a categorical input using binning and add a bin for missing values.
Imputation Methods
If you are confident that data is Missing at Random, then you might want to consider an imputation technique to handle missingness in your data.
Typically, in predictive modelling you can impute missing numeric values with an average of the series. Which type of average you choose may depend on what your summary statistics say about the data, for example a dataset with outliers may have an inflated arithmetic mean, in which case you may prefer the median or modal value. The obvious downside to this approach is that you are likely to over or under inflate the missing value for a given observation, however if there are relatively few missing values this may be safe to do and overall you will benefit from being able to include the rest of the complete non-missing observations.
A more sophisticated technique would be to fit a linear regression model on the series and impute the missing values with the predicted values based on your inputs. This might lead to an imputed value which is closer to what the missing value might have actually been. This can be good for a dataset which will be used for descriptive statistics or dashboards, however using these generated values as inputs to a predictive model may cause issues. Categorically, imputation and prediction are different topics.
You can also consider some techniques to generate synthetic data based on known complete cases, this would be more flexible than simply inserting an average and would not use predicted input values - but this can be a dangerous method if used incorrectly since it could create model overfitting and could introduce bias into the model if incorrect assumptions are used to create the synthetic data.
In summary, if used correctly imputation can be a useful way of correcting missingness in data so that models which rely on complete case analysis can be used, however any imputation technique should be leveraged with extreme caution and careful analysis.
In our next, and final, section of the series we look at using visual tools to accelerate our EDA.
For further details please go to the SAS Users YouTube channel and browse through the great videos by fellow data scientists.